
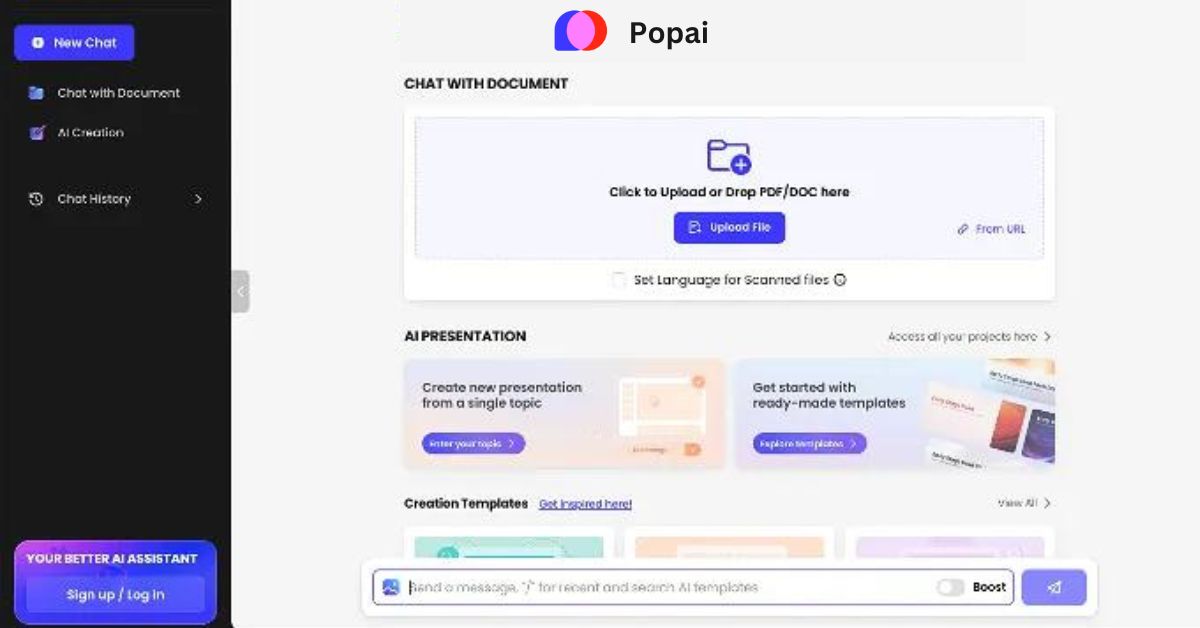
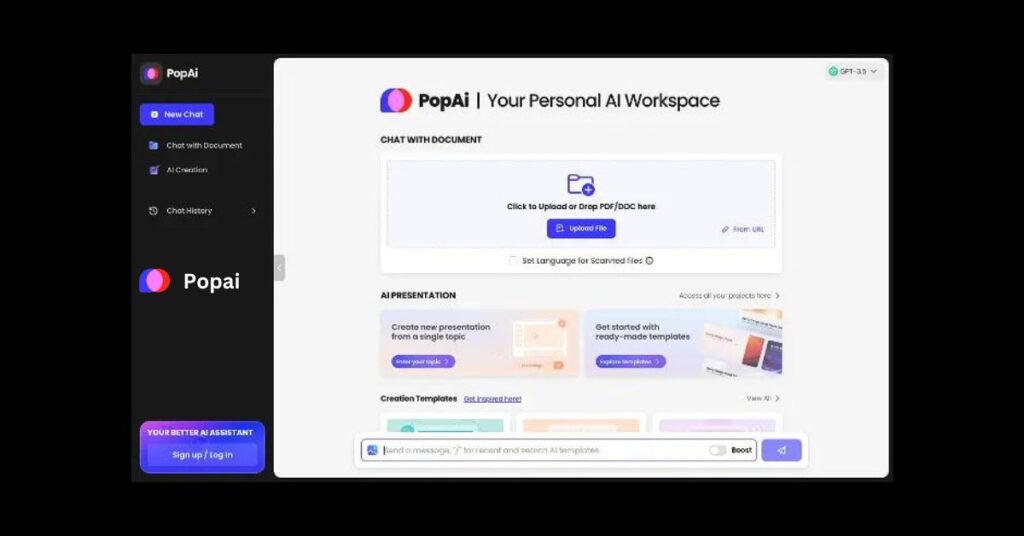
Financial analysts work with a lot of data to help businesses make smart decisions. This data can come from many different documents and sources. Using PopAI, a powerful AI tool, can make their job easier. PopAi helps analyze financial documents, generate reports, and visualize data. Let’s explore how it works, including its pre-built templates and data storytelling features.
Analyzing Financial Documents
Understanding Complex Documents
Financial documents, like balance sheets and income statements, can be very complex. PopAI can help by:
- Reading Documents: PopAI can read and understand financial documents quickly.
- Identifying Key Information: It can pick out important information, like revenue, expenses, and profit.
- Organizing Data: PopAI organizes this information in a way that makes it easy to understand and use.
Comparing Financial Data
Financial analysts often need to compare data from different documents. PopAI can:
- Find Similarities and Differences: It can compare different documents to find similarities and differences.
- Spot Trends: PopAI can identify trends in financial data over time, helping analysts understand how a company is performing.
Generating Reports
Creating Detailed Reports
Generating detailed reports is a big part of a financial analyst’s job. Pop AI PDF reader can help by:
- Automating Report Creation: It can automatically create reports based on the data it analyzes.
- Customizing Reports: PopAI can customize reports to meet the specific needs of the analyst or their clients.
- Ensuring Accuracy: By using advanced algorithms, PopAI ensures that the reports are accurate and reliable.
Speeding Up the Process
Creating reports manually can take a lot of time. PopAI speeds up this process by:
- Instant Analysis: It can analyze data instantly and generate reports quickly.
- Reducing Errors: PopAI reduces the chances of mistakes, ensuring that the information in the reports is correct.
Visualizing Data
Making Data Easy to Understand
Visualizing data means showing it in a way that is easy to understand, like charts and graphs. PopAI helps with this by:
- Creating Visuals: It can create various types of visuals, like bar charts, pie charts, and line graphs.
- Highlighting Key Points: PopAI highlights important points in the data, making it easier to see what matters most.
- Customizable Visuals: Analysts can customize the visuals to fit their needs and preferences.
Interactive Dashboards
PopAI can create interactive dashboards that allow financial analysts to:
- Explore Data: Analysts can interact with the data, exploring different aspects and details.
- Update in Real-Time: The dashboards can update in real-time, showing the latest data and trends.
- Share with Others: Analysts can share these dashboards with colleagues or clients, making collaboration easier.
Pre-Built Templates
Ready-to-Use Templates
PopAI comes with pre-built templates that financial analysts can use right away. These templates help by:
- Saving Time: Analysts don’t have to start from scratch. They can use these templates to quickly create reports and visuals.
- Ensuring Consistency: The templates ensure that reports and visuals have a consistent format and style.
- Customizing Templates: Analysts can customize the templates to fit their specific needs.
Types of Templates
Some types of pre-built templates PopAI offers include:
- Financial Reports: Templates for balance sheets, income statements, and cash flow statements.
- Data Visualizations: Templates for various charts and graphs.
- Performance Dashboards: Templates for creating interactive dashboards that show key performance indicators (KPIs).
Data Storytelling
Telling a Story with Data
Data storytelling means using data to tell a story. This helps make the data more engaging and easier to understand. PopAI helps with data storytelling by:
- Connecting the Dots: It can link different pieces of data together to create a clear and compelling story.
- Highlighting Key Insights: PopAI can highlight the most important insights, making the story more impactful.
- Visual Elements: Using visuals like charts and graphs, PopAI makes the data story more interesting and easier to follow.
Engaging Presentations
PopAI can help financial analysts create engaging presentations by:
- Creating Slides: It can automatically create slides that present the data story.
- Adding Visuals: PopAI adds visuals to the slides, making them more engaging.
- Narrative Flow: It ensures that the presentation has a logical and compelling narrative flow.
Conclusion
PopAI is a powerful tool that simplifies data analysis for financial analysts. It helps with analyzing financial documents, generating reports, and visualizing data. The pre-built templates and data storytelling features make it even more powerful by saving time and improving accuracy. By using PopAI, financial analysts can work more efficiently and provide better insights and recommendations.